ICU Patient Encounter Characteristics and Outcomes (2020-2021)

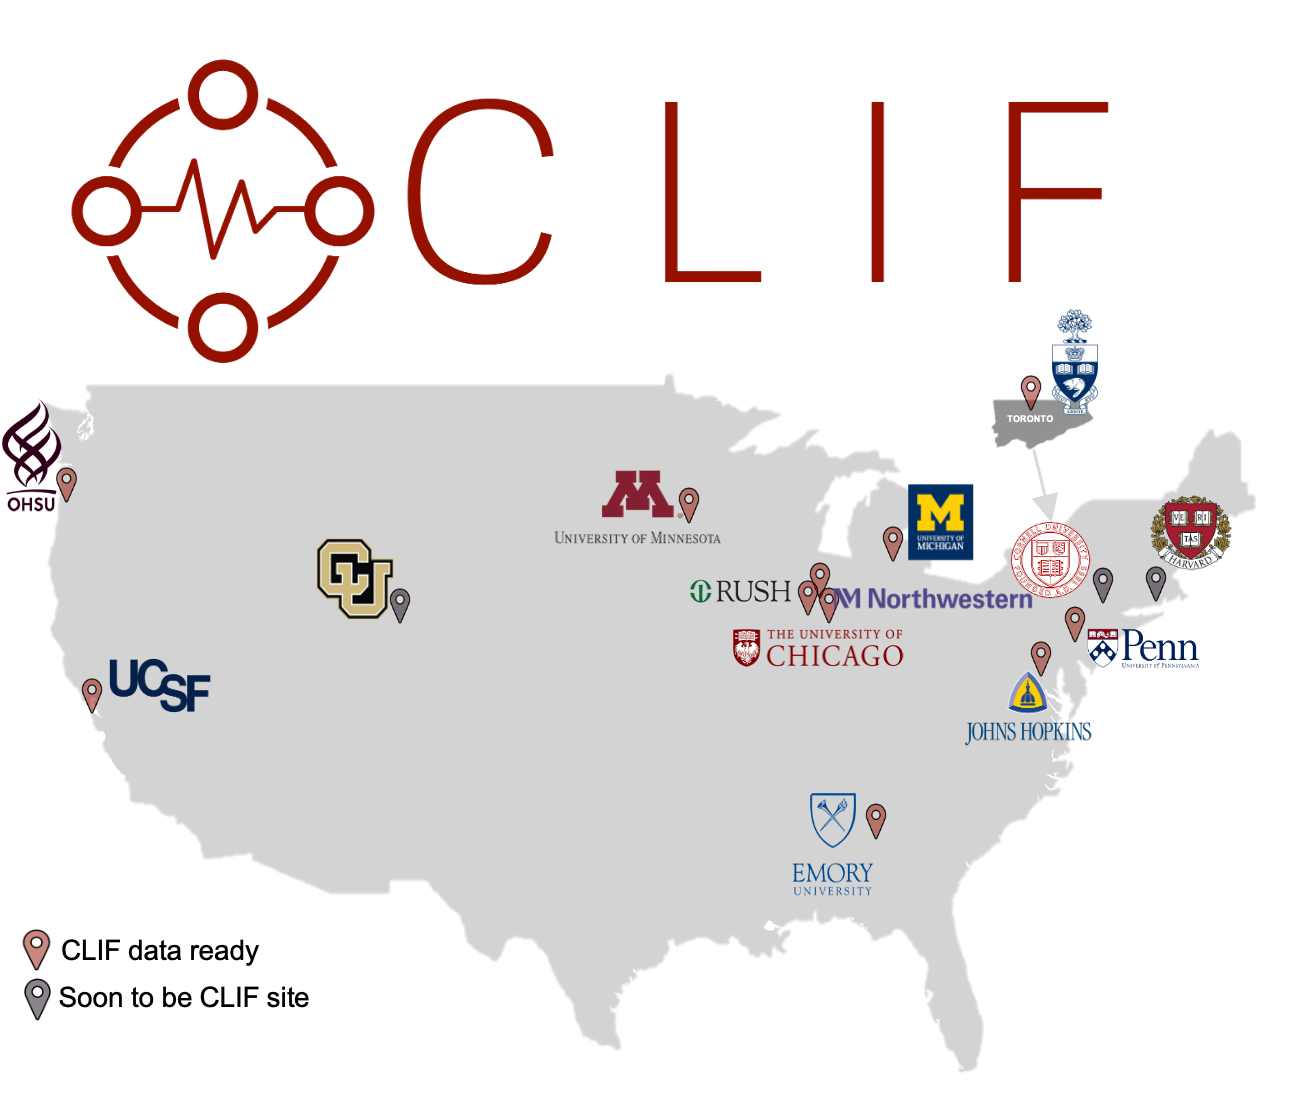
The table below showcases the characteristics and outcomes of ICU patient encounters across nine CLIF consortium sites. The cohort includes all adults (≥ 18 years) admitted to an ICU within 48 hours of hospitalization and staying at least 24 hours, from January 1, 2020, to December 31, 2021, at each site across the consortium. This represents a diverse cohort of over 111,000 ICU patient encounters and provides valuable insights into critical care practices across different institutions.

Characteristic CLIF Consortium (Combined) Emory University Johns Hopkins Health System Northwestern University Oregon Health & Science University Rush University University of Chicago University of Michigan University of Minnesota University of Pennsylvania
Hospitals 39 4 5 8 2 1 1 1 11 6
N 111440 15124 18242 17150 8559 9853 8053 7301 13130 14028
Age (years), mean (SD) 60.7 (17.1) 61.3 (16.4) 60.8 (17.4) 63.1 (17.1) 60.3 (17.4) 59.6 (16.9) 56.4 (18.5) 58.9 (16.2) 61.7 (17.3) 60.3 (16.9)
Female n (%) 49358 (44.3%) 7100 (46.9%) 8315 (45.6%) 7425 (43.3%) 3517 (41.1%) 4660 (47.3%) 3411 (42.4%) 3011 (41.2%) 5726 (43.6%) 6193 (44.1%)
Race n(%)
Asian 4062 (3.6%) 521 (3.4%) 790 (4.3%) 593 (3.5%) 258 (3.0%) 327 (3.3%) 148 (1.8%) 143 (2.0%) 847 (6.5%) 435 (3.1%)
Black 31063 (27.9%) 6707 (44.3%) 5643 (30.9%) 2199 (12.8%) 214 (2.5%) 3995 (40.5%) 5290 (65.7%) 879 (12.0%) 896 (6.8%) 5240 (37.4%)
White 66331 (59.5%) 6953 (46.0%) 10255 (56.2%) 12723 (74.2%) 6960 (81.3%) 3697 (37.5%) 2015 (25.0%) 5780 (79.2%) 10790 (82.2%) 7158 (51.0%)
Others 9984 (8.9%) 943 (6.2%) 1554 (8.5%) 1635 (9.5%) 1127 (13.2%) 1834 (18.6%) 600 (7.5%) 499 (6.8%) 597 (4.5%) 1195 (8.5%)
Ethnicity n(%)
Hispanic or Latino 7511 (6.7%) 577 (3.8%) 1088 (6.0%) 1753 (10.2%) 657 (7.7%) 1968 (20.0%) 514 (6.4%) 210 (2.9%) 249 (1.9%) 495 (3.5%)
Hospital mortality, n (%) 10721 (9.6%) 1307 (8.6%) 1905 (10.4%) 1502 (8.8%) 677 (7.9%) 729 (7.4%) 1004 (12.5%) 847 (11.6%) 1032 (7.9%) 1718 (12.2%)
Mechanical Ventilation, n (%) 42442 (39.09%) 6031 (39.9%) 6804 (37.3%) 5080 (29.6%) 3231 (37.7%) 2859 (29.0%) 3462 (43.0%) 4007 (54.9%) 4801 (36.6%) 6167 (44.0%)
Initial Mode category for Ventilated Encounters, n(%)
Assist Control-Volume Control 25711 (60.58%) 2501 (41.57%) 3942 (57.95%) 4284 (84.33%) 2623 (81.18%) 337 (11.79%) 2810 (81.17%) 1097 (27.38%) 4453 (92.77%) 3664 (59.41%)
Pressure-Regulated Volume Control 6783 (15.98%) 1004 (16.65%) 1335 (19.62%) 174 (3.43%) 60 (1.86%) 1740 (60.86%) 0 (0%) 2416 (60.29%) 52 (1.08%) 2 (0.03%)
Pressure Control 1188 (2.80%) 124 (2.06%) 106 (1.56%) 151 (2.97%) 89 (2.75%) 280 (9.79%) 80 (2.31%) 225 (5.62%) 73 (1.52%) 60 (0.97%)
Pressure Support/CPAP 3057 (7.20%) 466 (7.73%) 277 (4.07%) 161 (3.17%) 260 (8.05%) 402 (14.06%) 419 (12.1%) 37 (0.92%) 91 (1.9%) 944 (15.31%)
SIMV 3486 (8.21%) 668 (11.08%) 1086 (15.96%) 196 (3.86%) 0 (0%) 25 (0.87%) 52 (1.5%) 0 (0%) 61 (1.27%) 1398 (22.67%)
Other 581 (1.37%) 31 (0.51%) 57 (0.84%) 5 (0.1%) 185 (5.73%) 8 (0.28%) 31 (0.9%) 212 (5.29%) 23 (0.48%) 29 (0.47%)
No mode documented 1636 (3.85%) 1237 (20.51%) 1 (0.0%) 109 (2.15%) 14 (0.43%) 67 (2.34%) 70 (2.02%) 20 (0.5%) 48 (0.98%) 70 (1.14%)
Ventilator Settings
Fio2 Median [IQR] 0.4 [0.37, 0.60] 0.4 (0.4, 0.6) 0.4 (0.4, 0.6) 0.4 (0.4, 0.6) 0.35 (0.28, 0.5) 0.4 (0.35, 0.7) 0.4 (0.4, 0.6) 0.4 (0.4, 0.6) 0.4 (0.35, 0.6) 0.4 (0.4, 0.6)
Peep Median [IQR] 5.0 [5.4, 8.03] 6.0 (6.0, 10.0) 5.0 (5.0, 8.0) 5.0 (5.0, 8.0) 5.0 (5.0, 7.0) 8.0 (8.0, 8.0) 5.0 (5.0, 8.0) 5.1 (5.0, 10.0) 5.0 (5.0, 8.0) 5.0 (5.0, 8.0)